Hydrant Flow Test 6.0 features dynamic spreadsheets
for calculating and displaying the results
of single or multiple hydrant flow tests. There is no limit on the number of flow test locations and outlets flowed.
The dynamic graph responds immediately to changes in all major hydrant flow test parameters.
The graph displays extrapolated flow at 0 psi, 20 psi and other user defined values of pressure.
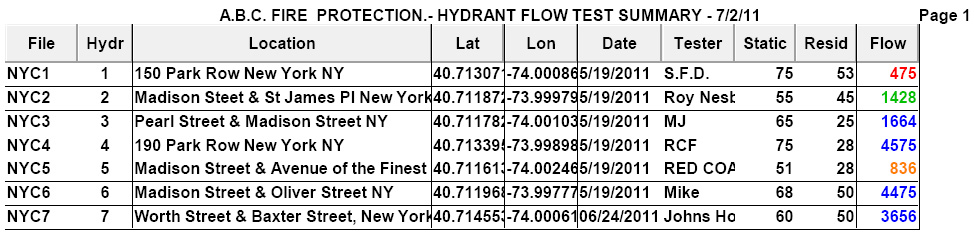
The Mapping Module plots color coded Class AA, A & B hydrant markers by street address or GPS coordinates.
The Hydrant Flow Test 6.0 Geocoder translates street addresses
to GPS coordinates.
The Geocoder features a marker tool that can be dragged and dropped on the map
to determine precise GPS coordinates for any place on earth.
Reports, graphs and maps can be printed for individual or multiple hydrant flow tests.
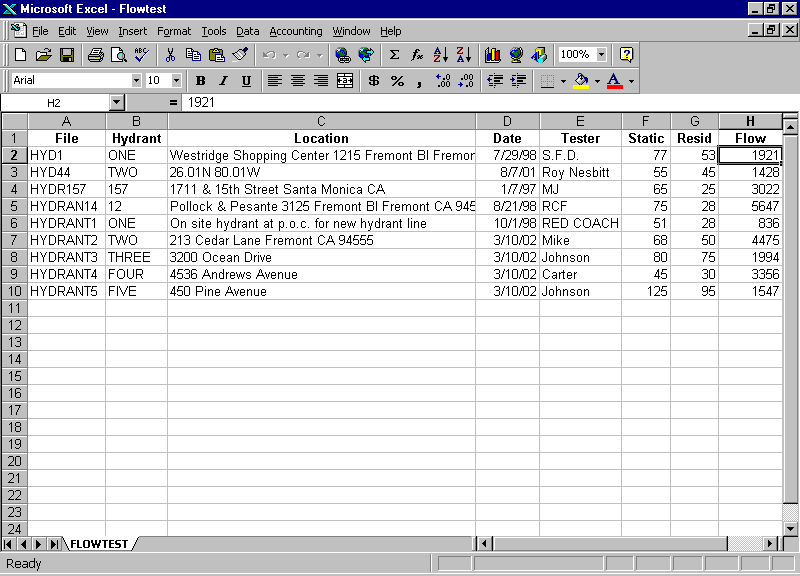
Flow test parameters and results are displayed in a scrollable Summary spreadsheet.
The spreadsheet can be sorted and searched for results matching
file name, hydrant, location, date, static, residual, flow and other variables.
Copy and Paste hydrant flow test summary results to Microsoft Excel.